by
by Analysis looks at building permit figures and the proportion of funds each area allocated toward housing-related investment to determine the top growth areas
HIGH POINT — Each month, Home News Now reports on new home construction and existing home sales to provide the industry a look at some of the main drivers of furniture sales now and in the near future.
This data typically offers both an overall national window into housing activity and breaks it down broadly by region, including the Northeast, Midwest, South and West.
More than anything, this provides a teaser for retailers wanting a glimpse into where activity is occurring. For more specifics, they have to pay attention to what’s happening in their respective markets, which can be seen by simply noticing building activity in and just outside the communities they serve.
Other data from time to time also becomes available that’s worth a look, including a recent survey sent our way that identifies the fastest-growing metro areas based on new construction. This survey by S-Line Contractors looked at the number of new residential building permits issued earlier this year and GDP data from two years ago to identify the top markets around the U.S. for new housing.
Note that the data looks at just two months of activity, January and February, meaning that it is extremely limited in scope. Still the results are worth noting.
It specifically analyzed information provided by the Building Permits Survey from the U.S. Census Bureau that identified the number of new privately owned residential units authorized per 100,000 people during each month. It also looked at 2023 data from the Bureau of Economic Analysis to identify construction-related activity as a percentage of the metro area’s total GDP “to determine the proportion of funds each area was allocating towards housing growth and investment within the period.”
According to its findings, the Lafayette-West Lafayette area of Indiana took the No. 1 spot with 630 permits issued per 100,000 people the first two months of the year. It also was found to have committed 4.46% of its total GDP toward residential construction projects in 2023.
This was followed by Carson City, Nevada, with 429 new permits issued per 100,000 residents earlier this year, with 6.04% of the area’s total GDP allocated toward construction costs in 2023.
Next in the Top 5 was Sherman-Denison, Texas, just north of Dallas, which had 359 new permits issued per 100,000 people during the period, and 7.92% of its GDP going toward construction projects in 2023.
Cape Coral-Fort Myers, Florida, had 344 new permits issued per 100,000 people, and also had 9.73% of its GDP related to residential construction activity in 2023, which was the sixth highest construction-related GDP rate.
Ocala, Florida, had 307 new permits issued per 100,000 residents and reported 9.54% of the area’s GDP allocated to construction in 2023, the eighth highest of any city during this period.
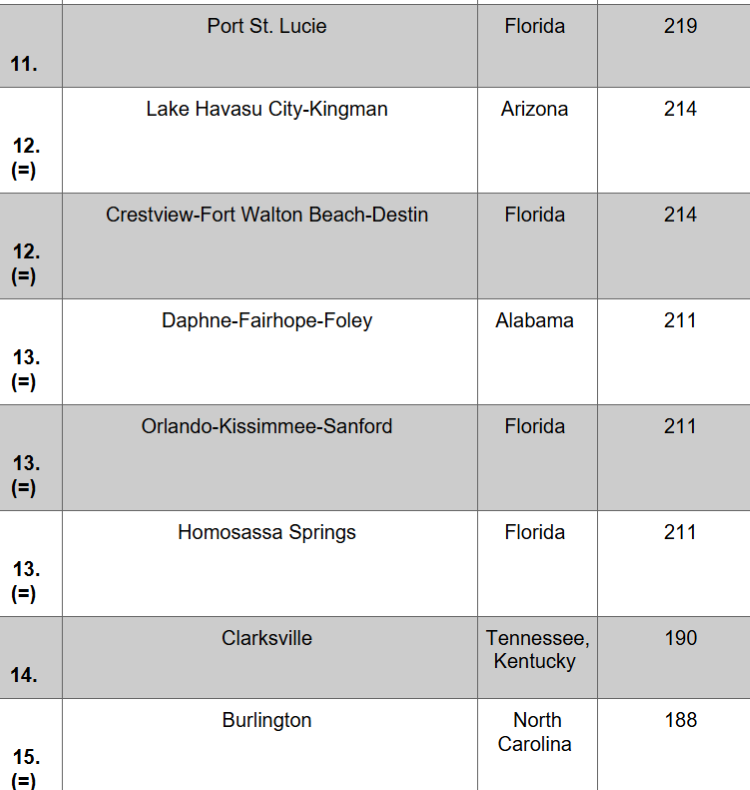
Also in the Top 10 were Punta Gorda, Florida, with 299 new permits per 100,000 residents and reporting 11.93% of the total GDP to construction spending in 2023, the third most of anywhere in the U.S.; Greenville, North Carolina, with 298 permits per 100,000 residents and construction expenditures of 4.58% of the area’s total GDP; Wilmington, North Carolina, with 279 permits issued per 100,000 residents and allotting 6.69% of the local GDP to residential construction; Lakeland/Winter Haven, Florida, with 257 residential permits issued per 100,000 residents and 6.29% of the local GDP allotted toward construction spending; and Naples/Marco Island, Florida, which had 227 residential permits issued per 100,000 residents and 9.04% of the area’s total GDP going toward construction, which officials said was the 10th highest residential spending in the country.
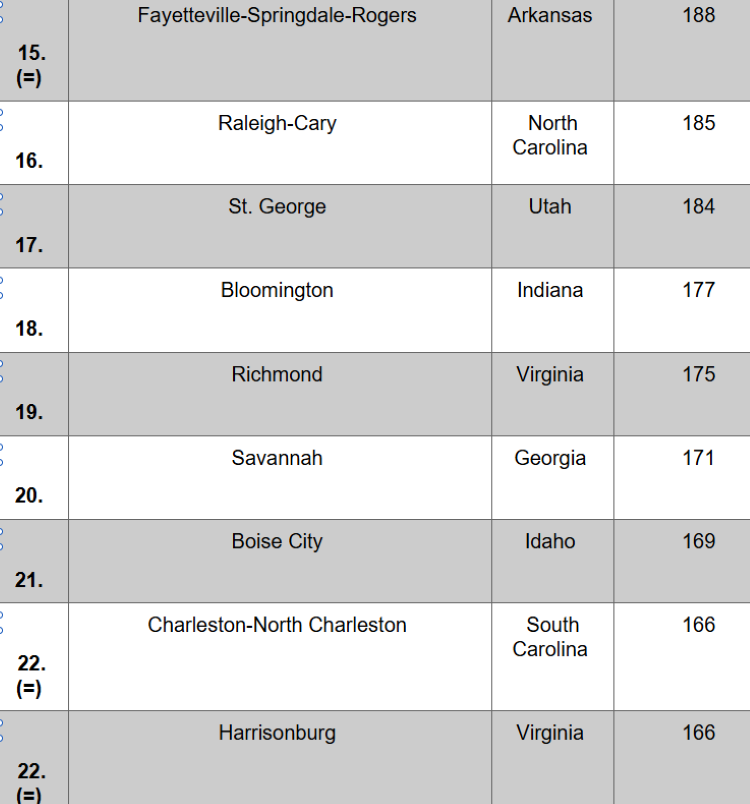
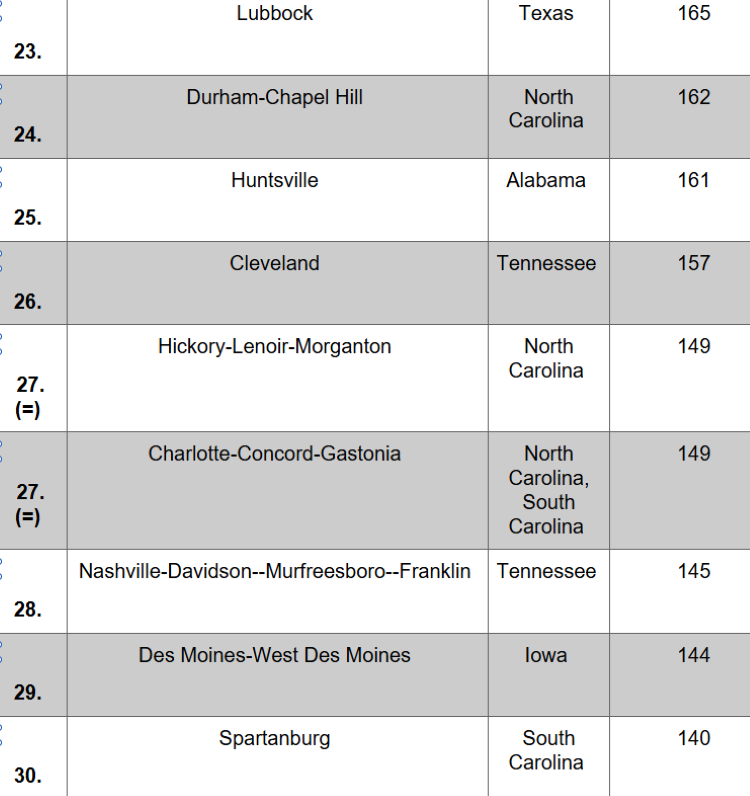
The full ranking of 30 metro areas can be seen in the companion charts shown below.
Sam Bitar, of S-Line Construction, said that the data is positive news for the top areas identified in the ranking.
“The boost in construction projects within these rapidly expanding locales indicates economic vitality,” he noted, adding, “The housing market may feel stagnant right now in many places across the U.S., but these cities are operating against the trend. A high number of new residences reflects both an increase in residential demand and a willingness of local government to devote the necessary funds to developing these areas.”
Obviously these rankings will change with the issuance of residential permits during any given period. However, they also suggest these are areas to watch moving forward.
But we would also note that other metro areas in and outside these particular states are also worth watching by those who live and do business in those areas.
Furniture sales almost always follow the move into a new home, whether it’s new construction or an existing home sale. So paying close attention to what’s happening in one’s surrounding community, not to mention the types of houses being built, ranging from starter homes to second homes, is an important step to knowing what type of furniture to sell and how to advertise for those in the market.