by
by Upholstery remains the No. 1 category sought by shoppers, but primary bedroom also remains a key area of interest
HIGH POINT — In our second installment of Consumer Insights Now, sponsored by Bread Financial, upholstery once again took the top spot in the most popular items sought by shoppers looking to update their home.
Consistent with prior CIN surveys, sofas were the No. 1 category, with 41% of furniture shoppers saying they purchased a sofa this year. It was the most popular among younger millennials, ages 29-36, with 53% in that age group purchasing upholstery between January and August.
This was followed by Gen Z (ages 18-28) with 48% surveyed buying upholstery and 45% of older millennials surveyed (ages 37-44) saying they also purchased upholstery, followed by 36% of Gen X (ages 45-60) and 21% of baby boomers (ages 61 and up).
Thus, the living room remains a core emphasis for today’s shoppers as seen not only with upholstery purchases, but also other items that complete the room. This included area rugs, purchased by 34% of consumers; lamps, purchased by 27% of consumers; and occasional tables, purchased by 25% of those surveyed. Falling further down the list in the No. 7 and 9 positions respectively were recliners (20%) and home entertainment (17%).
For retailers, this highlights the importance of prominently displaying the living room category in your stores, particularly near the front entrance with plenty of natural light — not to mention lamps — gracing the display. With consumers spending so much of their spare time relaxing in these spaces, it also means promoting these categories in marketing, ranging from the store’s website to TV ads, mailers and other print circulars, not to mention on social media.
Highlighting this area of the home will signify to shoppers that you are attuned to their wants and needs, while also offering competitive deals, particularly on domestic upholstery that avoids higher costs related to tariffs.
Still, to the surprise of case goods suppliers, the survey showed consumers also are focused on the primary bedroom category. Twenty-three percent of those surveyed said they purchased a mattress for the primary bedroom, followed by 22% of those who said they also purchased primary bedroom furniture, making these the top five and six most popular categories.
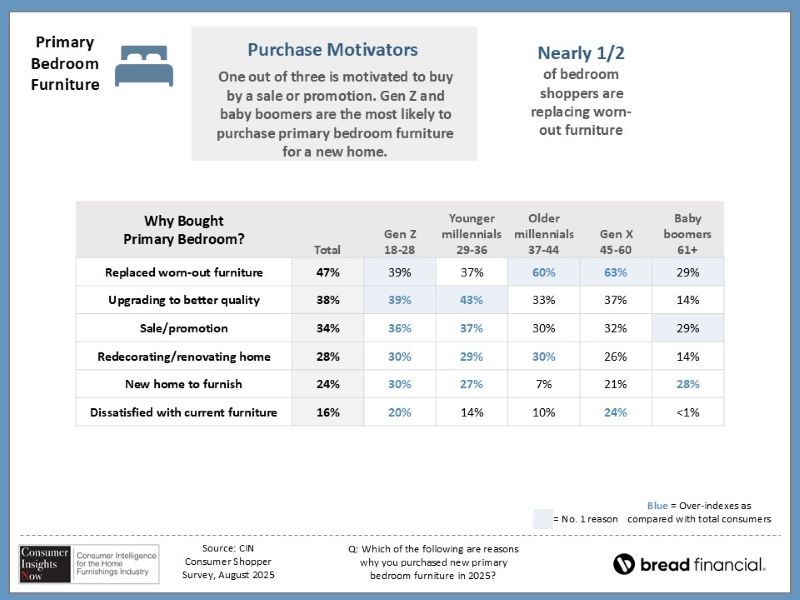
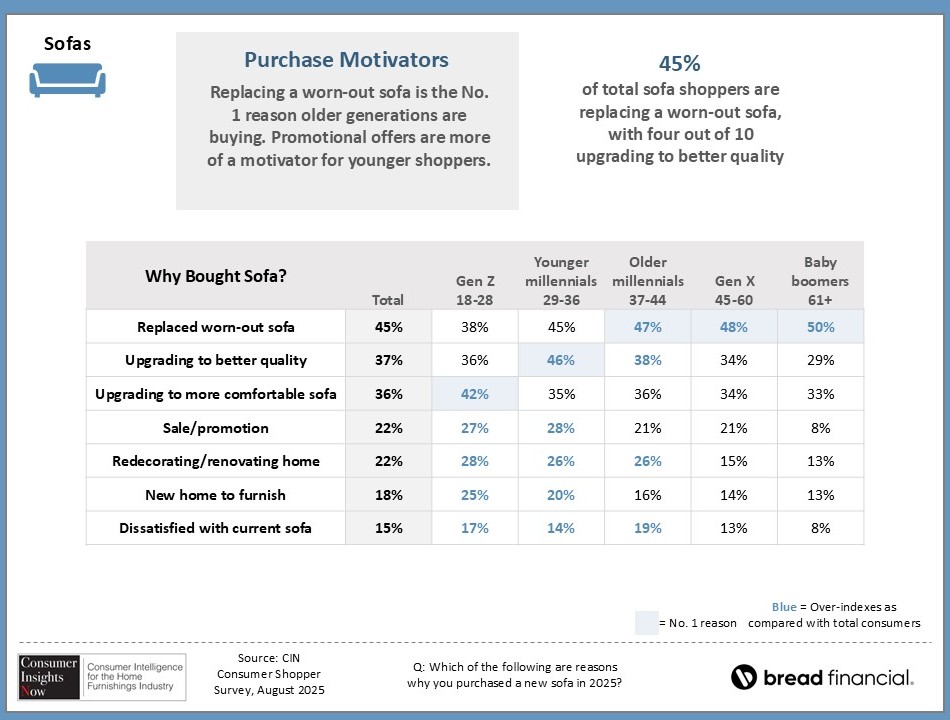
Those surveyed also noted that they were replacing older or worn-out sofas and mattresses, another key driver for outdoor furniture, which was purchased by 14% of those surveyed, as was dining furniture. This driver spanned all income groups. Consumers also said they were upgrading to better quality and more comfortable furniture, particularly for upholstery.
And while a good sale was a motivating factor for all income groups, one of three consumers who purchased primary bedroom furniture was driven by strong promotional activity in the segment. Promotions also were key drivers for younger consumers including Gen Z and younger millennials.
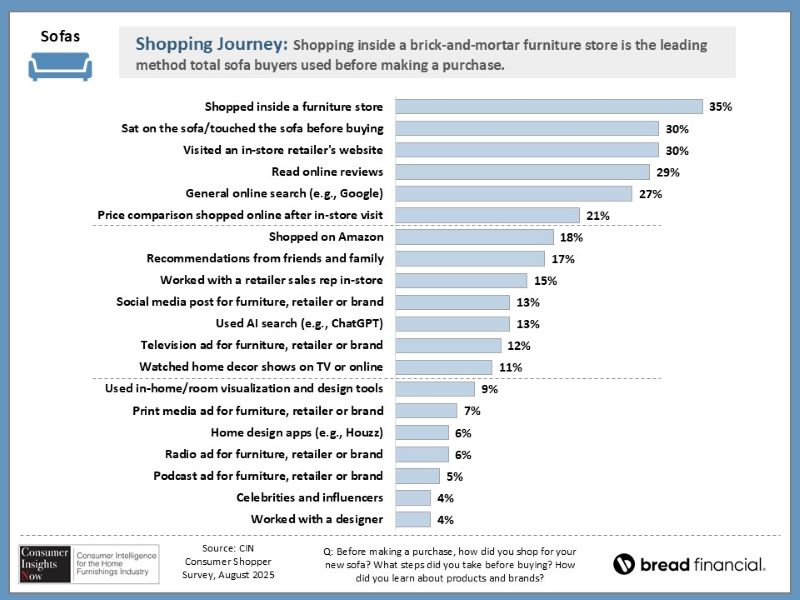
The survey also offers insights into where shoppers purchased key categories including upholstery and primary bedroom furniture. For example, 27% of upholstery buyers started their search online, and 29% to 30% respectively read online reviews and visited a retailer’s website when shopping the category.
However, 30% sat on the sofa and 35% shopped in a physical store location compared with 18% who shopped on Amazon, for example.
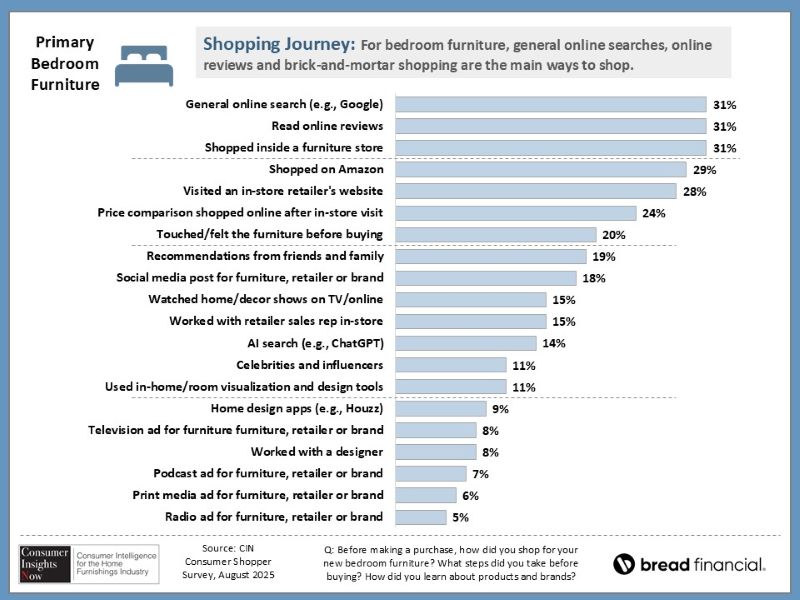
This compares with 31% who read online reviews and did an online search for primary bedroom furniture, while also shopping in a furniture store for the category. However, 29% by comparison shopped on Amazon for the category, while 24% did price comparisons online after visiting the retailer’s store. This compares to 21% who did price comparisons online for upholstery.
When it came to actual purchases, 32% purchased primary bedroom in a national furniture chain, compared with 18% respectively on Amazon or a local furniture store, 16% at a big-box retailer and 6% on Wayfair. By comparison, 50% of those surveyed purchased a sofa at a national furniture chain, 18% at a local furniture store, 11% at a big-box retailer, 8% on Amazon and 4% on Wayfair.
The survey also shares insights into other factors guiding the purchase in each category ranging from an AI-generated search to ads on TV radio and social media, for example. These factors are also key in that they let retailers know what are the most effective ways in reaching consumers.
As always, we hope this information proves useful in guiding some of your store’s own efforts to reach consumers and how to best promote various categories.
Below is the schedule for this season’s Consumer Insights Now reports:
+ Sept. 15 – Furniture Shopper Perceptions About the Economy.
+ Sept 22 – The Shopping Journey and Motivators for Consumer Furniture Purchases.
+ Sept. 29 – Needs and Driving Factors for Consumers Shopping for Furniture.
+ Oct. 6 – Buying In Store Vs. Online.
+ Oct. 13 – Motivations and Attitudes of Today’s Consumers.